

Question: Display the data given in Table 8.5 in an appropriate form and state how the variables are correlated. X: y: Table 8.5 0 806 15
Display the data given in Table 8.5 in an appropriate form and state how the variables are correlated.
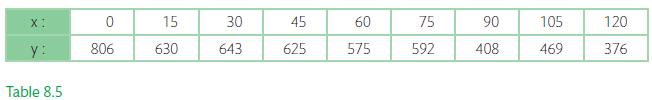
X: y: Table 8.5 0 806 15 630 30 643 45 625 60 575 75 592 90 408 105 469 120 376
Step by Step Solution
★★★★★
3.34 Rating (157 Votes )
There are 3 Steps involved in it
1 Expert Approved Answer
Step: 1 Unlock

Question Has Been Solved by an Expert!
Get step-by-step solutions from verified subject matter experts
Step: 2 Unlock
Step: 3 Unlock