

Question: Draw a suitable bar chart for the data in Table 1.16. Industrial sources for consumption and investment demand (thousand million) Producing industry Agriculture, mining Metal
Draw a suitable bar chart for the data in Table 1.16.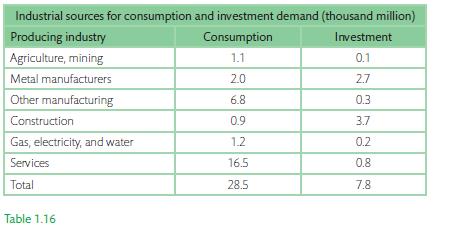
Industrial sources for consumption and investment demand (thousand million) Producing industry Agriculture, mining Metal manufacturers Other manufacturing Construction Gas, electricity, and water Services Total Table 1.16 Consumption 1.1 2.0 6.8 0.9 1.2 16.5 28.5 Investment 0.1 2.7 0.3 3.7 0.2 0.8 7.8
Step by Step Solution
★★★★★
3.37 Rating (150 Votes )
There are 3 Steps involved in it
1 Expert Approved Answer
Step: 1 Unlock

Here is the bar chart for Table 116 showing industrial sources of Consu... View full answer
Question Has Been Solved by an Expert!
Get step-by-step solutions from verified subject matter experts
Step: 2 Unlock
Step: 3 Unlock