

Question: For the time series data presented in Table 9.10 calculate seasonal forecasts using the simple seasonal additive exponential smoothing model. If we plot the time
For the time series data presented in Table 9.10 calculate seasonal forecasts using the simple seasonal additive exponential smoothing model.
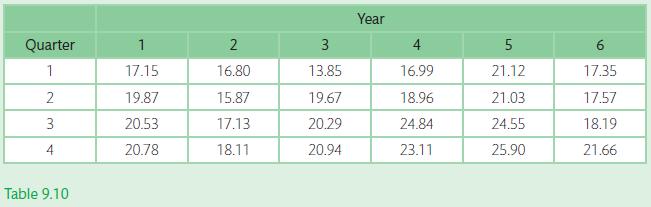
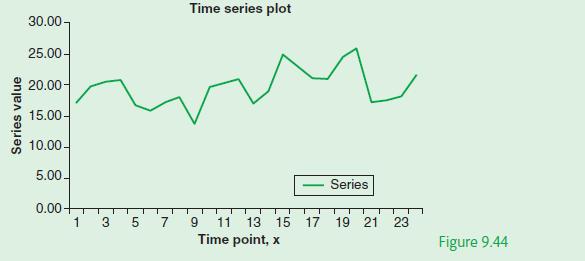
If we plot the time series as illustrated in Figure 9.44 we note that we have a definite pattern in the shape of the curve, which repeats over the same time period quarters.
This suggests a seasonal module would be appropriate.
Quarter 1 2 3 4 Table 9.10 1 17.15 19.87 20.53 20.78 2 16.80 15.87 17.13 18.11 3 13.85 19.67 20.29 20.94 Year 16.99 18.96 24.84 23.11 5 21.12 21.03 24.55 25.90 6 17.35 17.57 18.19 21.66
Step by Step Solution
3.43 Rating (159 Votes )
There are 3 Steps involved in it
Figure 945 illustrates the Excel solution Excel solution ... View full answer

Get step-by-step solutions from verified subject matter experts