

Question: Obtain a scatter plot for the data in Table 1.37 that represents the passenger miles flown by a UK-based airline (millions of passenger miles) during
Obtain a scatter plot for the data in Table 1.37 that represents the passenger miles flown by a UK-based airline (millions of passenger miles) during the period 2003–2004.
Comment on the relationship between miles flown and quarter.
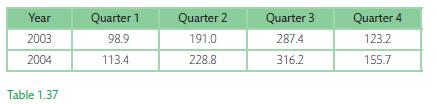
Year 2003 2004 Table 1.37 Quarter 1 98.9 113.4 Quarter 2 191.0 228.8 Quarter 3 287.4 316.2 Quarter 4 123.2 155.7
Step by Step Solution
★★★★★
3.59 Rating (160 Votes )
There are 3 Steps involved in it
1 Expert Approved Answer
Step: 1 Unlock

Question Has Been Solved by an Expert!
Get step-by-step solutions from verified subject matter experts
Step: 2 Unlock
Step: 3 Unlock