

Question: Reconsider Example 8.1 and calculate a 95% confidence interval for the slope coefficient of the predictor variable. Data from Example 8.1 A large manufacturing firm
Reconsider Example 8.1 and calculate a 95% confidence interval for the slope coefficient of the predictor variable.
Data from Example 8.1
A large manufacturing firm with some 8000 employees has designed a training programme that is supposed to increase the production of employees. The personnel manager decides to examine this claim by analysing the data results from the first group of 20 employees that attended the course.
Table 8.1 provides the data set for the % change in production (y) measured against a range of production values (x).
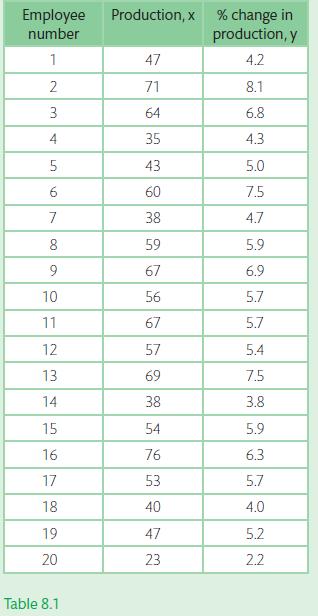
Employee number 1 2 3 4 LO 5 6 7 8 9 10 11 12 13 14 15 16 67 17 18 19 20 Table 8.1 Production, x % change in production, y 4.2 47 71 64 35 43 60 38 59 67 56 67 57 69 38 54 76 53 40 47 23 8.1 6.8 4.3 5.0 7.5 4.7 5.9 6.9 5.7 5.7 5.4 7.5 3.8 5.9 6.3 5.7 4.0 5.2 2.2
Step by Step Solution
3.28 Rating (157 Votes )
There are 3 Steps involved in it
Figure 831 illustrates the Excel solution Interpretation From Excel the 95 confidence interval for E... View full answer

Get step-by-step solutions from verified subject matter experts