

Question: Fit an appropriate equation to the data set (Table 8.15) to predict the examination mark given the assignment mark for 14 undergraduate students. (a) Plot
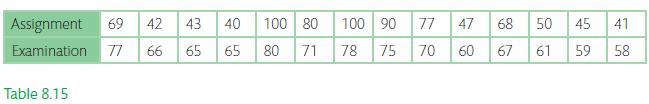
Fit an appropriate equation to the data set (Table 8.15) to predict the examination mark given the assignment mark for 14 undergraduate students.
(a) Plot a scatter plot and comment on a possible relationship between sales and advertising.
(b) Use Excel regression functions to undertake the following tasks:
(i) Fit linear model
(ii) Check model reliability (r and COD)
(iii) Undertake appropriate inference tests (t and F test)
(iv) Check model assumptions (residual and normality checks)
(v) Provide a 95% confidence interval for the predictor variable.
Assignment 69 42 43 Examination 77 66 65 65 Table 8.15 40 100 80 80 71 100 90 77 78 75 70 60 67 47 68 50 61 45 41 59 58
Step by Step Solution
3.36 Rating (159 Votes )
There are 3 Steps involved in it

Get step-by-step solutions from verified subject matter experts