

The distribution of marks of 400 candidates in an A-level examination is presented in Table 2.12. (a)
Question:
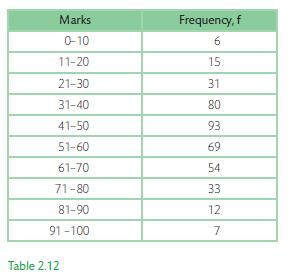
The distribution of marks of 400 candidates in an A-level examination is presented in Table 2.12.
(a) Calculate the mean value.
(b) Construct the cumulative frequency curve and estimate the median, fi rst, and third quartile values.
Fantastic news! We've Found the answer you've been seeking!
Step by Step Answer:
a For the mean value we start with calculating the midpoint of each class interval This midpoint will be the representative value of the interval Mark...View the full answer

Answered By
Omar ELmoursi
I'm Omar, I have Bachelor degree in Business and Finance, My unique approach is to help students with questions and assignments, I can teach Business, Math, Accounting, Managerial Accounting, Economy, Human resources management, organizational behavior, project management, I have experience dealing with different types of students and teach them how to deal with different types of exercises.
4+ Reviews
10+ Question Solved
Related Book For 

Question Posted:
