

Question: Answer the following questions using the data from the Excel file Spain unemployment.xlsx from Problem 16.45. a. Construct a graph showing the annual unemployment rate
Answer the following questions using the data from the Excel file Spain unemployment.xlsx from Problem 16.45.
a. Construct a graph showing the annual unemployment rate for Spain over time.
b. Forecast the unemployment rate for Spain in 2018 using a trend projection.
c. Calculate the MAD for the forecast in part b.
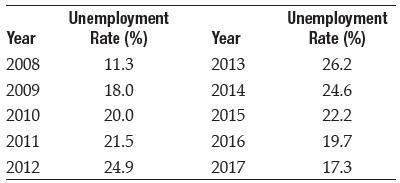
Unemployment Rate (%) Unemployment Rate (%) Year Year 2008 11.3 2013 26.2 2009 18.0 2014 24.6 2010 20.0 2015 22.2 2011 21.5 2016 19.7 2012 24.9 2017 17.3
Step by Step Solution
3.41 Rating (151 Votes )
There are 3 Steps involved in it
a b n 10 t 55 y 2057 ty 11751 t 2 385 c It is clear that the linear trend model i... View full answer

Get step-by-step solutions from verified subject matter experts