

Question: Bold names shown with a question identify the data table for the problem. Employment This table shows percentages of men and women employed in four
Employment
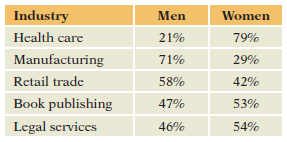
This table shows percentages of men and women employed in four industries.
(a) Is there association between the gender of the employee and the industry? How can you tell?
(b) Interpret the association (or lack thereof).
(c) Find the chi-squared statistic and Cramer€™s V if these data were derived from n = 500 employees, with 100 in each industry. Repeat the process for data derived from n = 2,000 employees, with 400 in each industry. Which statistic changes? Which remains the same?
Industry Men Women Health care 79% 21% Manufacturing 29% 71% Retail trade 58% 42% Book publishing 47% 53% Legal services 46% 54%
Step by Step Solution
3.40 Rating (162 Votes )
There are 3 Steps involved in it
a Marginally given a balanced number of cases in each industry the marginal proportio... View full answer

Get step-by-step solutions from verified subject matter experts