

Cloud Cover in San Francisco-Online The plots in Exercise 2.254 on cloud cover in San Francisco can
Question:
Cloud Cover in San Francisco-Online The plots in Exercise 2.254 on cloud cover in San Francisco can be found online at
weatherlines.zanarmstrong.com
if you prefer Figure 2.99(a) or
weather.zanarmstrong.com
if you prefer Figure 2.99(b).
In the interactive display you can hover over points to get more information. You can also click on the map to change the city or the drop down menu to change the weather statistic that is plotted. Use the interactive plots at this website to answer the questions below.
(a) In San Francisco, approximately what time of day has the highest percent cloud cover in August?
(b) Which season tends to be the least windy for Chicago (the "Windy City")?
Data From Exercise 2.254:
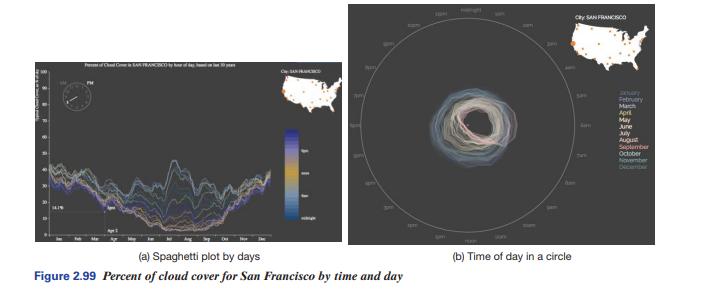
Often, the same dataset can be visualized in many different ways. Figure 2.99 shows two different visualizations of San Francisco's typical cloud cover (as a percent of the sky) for each day of the year and time of day, based on the same data from the last 30 years. Figure 2.99 (a) shows a spaghetti plot with each hour of the day depicted with a separate strand, and Figure 2.99 (b) displays the data with a different curve for every day of the year (the center of the circle is \(0 \%\) cloud cover, the outer circle is \(100 \%\) ). Both visualizations are created using the same data, and both convey the same information.
Figure 2.99:
Step by Step Answer:

This question has not been answered yet.
You can Ask your question!


Statistics, Enhanced Unlocking The Power Of Data
ISBN: 9781119308843
2nd Edition
Authors: Robin H Lock, Patti Frazer Lock, Kari Lock Morgan, Eric F Lock, Dennis F Lock
