

Cloud Cover in San Francisco Often, the same dataset can be visualized in many different ways. Figure
Question:
Cloud Cover in San Francisco Often, the same dataset can be visualized in many different ways. Figure 2.99 shows two different visualizations of San Francisco's typical cloud cover (as a percent of the sky) for each day of the year and time of day, based on the same data from the last 30 years. Figure 2.99 (a) shows a spaghetti plot with each hour of the day depicted with a separate strand, and Figure 2.99 (b) displays the data with a different curve for every day of the year (the center of the circle is $0 %$ cloud cover, the outer circle is $100 %$ ). Both visualizations are created using the same data, and both convey the same information; you may use whichever you find more intuitive to answer the following questions.
(a) Do mornings or evenings typically have more cloud cover, in general?
(b) Which season (winter, spring, summer, or fall) typically shows the most variability in cloud cover throughout the day?
(c) Which visualization do you find easier to interpret? (The answer may depend on the question of interest and there is no right or wrong answer.)
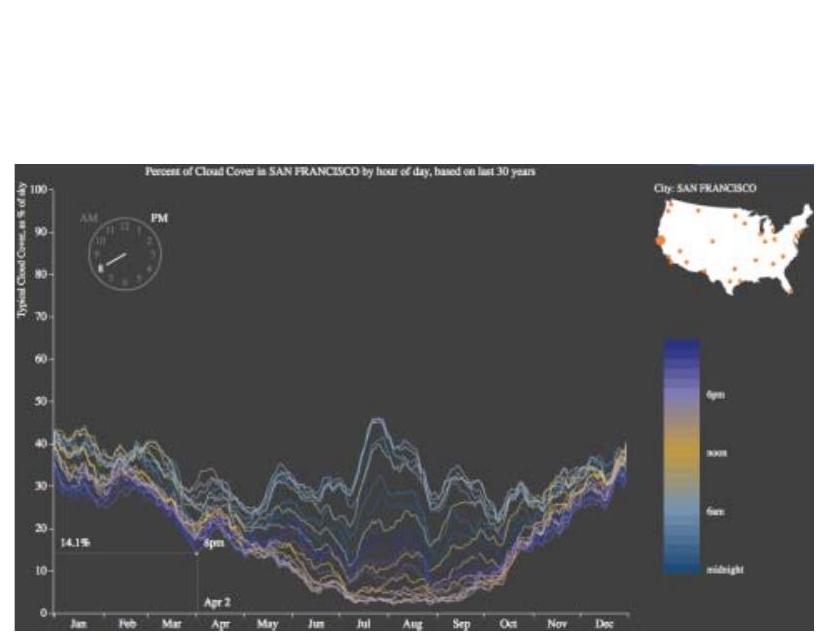
(a) Spaghetti plot by days
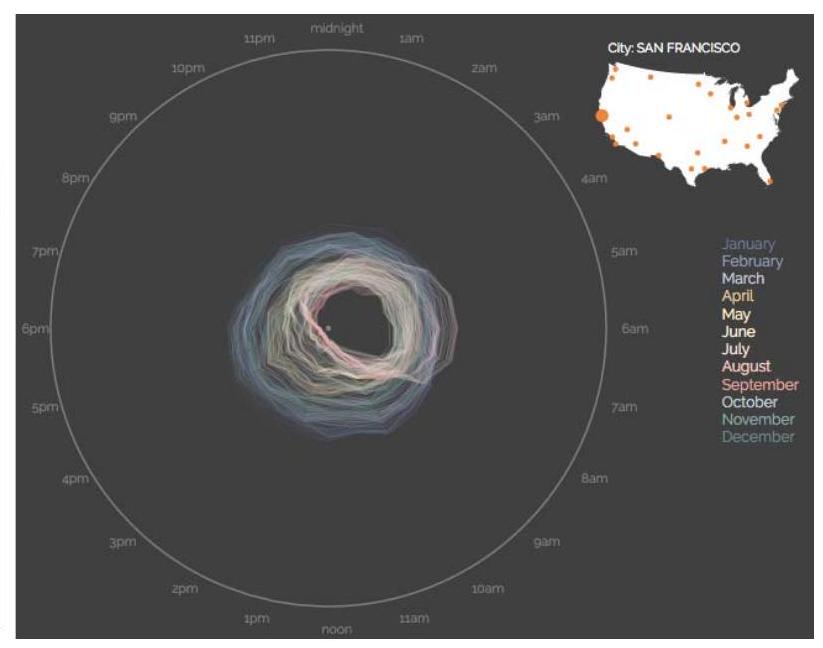
(b) Time of day in a circle
Figure 2.99 Percent of cloud cover for San Francisco by time and day
Step by Step Answer:

This question has not been answered yet.
You can Ask your question!


Statistics, Enhanced Unlocking The Power Of Data
ISBN: 9781119308843
2nd Edition
Authors: Robin H Lock, Patti Frazer Lock, Kari Lock Morgan, Eric F Lock, Dennis F Lock
