

Question: Construct a histogram and a stem-and-leaf display of the teams operating incomes. In the National Basketball Association (NBA) lockout of 2011, the owners of NBA
Construct a histogram and a stem-and-leaf display of the teams€™ operating incomes.
In the National Basketball Association (NBA) lockout of 2011, the owners of NBA teams wished to change the existing collective bargaining agreement with the NBA Players Association. The owners wanted a €œhard salary cap€ restricting the size of team payrolls. This would allow €œsmaller market teams€ having less revenue to be (1) financially profitable and (2) competitive (in terms of wins and losses) with the €œlarger market teams.€ The NBA owners also wanted the players to agree to take less than the 57 percent share of team revenues that they had been receiving. The players opposed these changes. Table 3.2 on the next page gives, for each NBA team, the team€™s 2009€“2010 revenue, player expenses (including benefits and bonuses), and operating income as given on the Forbes.com website on Octo-ber 26, 2011. Here, the operating income of a team is basically the team€™s profit (that is, the team€™s revenue minus the team€™s expenses including player expenses, arena expenses, etc.€”but not including some interest, depreciation, and tax expenses).
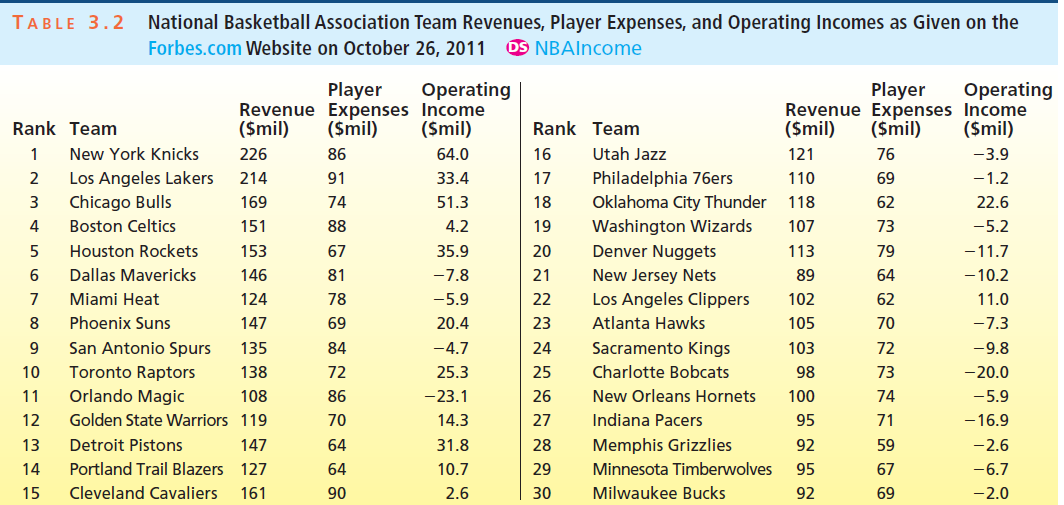
National Basketball Association Team Revenues, Player Expenses, and Operating Incomes as Given on the Forbes.com Website on October 26, 2011 OS NBAIncome TABLE 3.2 Player Revenue Expenses Income (Smil) Operating Player Revenue Expenses Income (Smil) Operating (Smil) Rank Team Rank Team ($mil) (Smil) ($mil) Utah Jazz New York Knicks 226 86 64.0 16 121 76 -3.9 Los Angeles Lakers Chicago Bulls Philadelphia 76ers Oklahoma City Thunder 2 214 91 33.4 17 110 69 -1.2 3 169 74 51.3 18 118 62 22.6 Boston Celtics Washington Wizards 4 151 88 4.2 19 107 73 -5.2 Houston Rockets Denver Nuggets 153 67 35.9 20 113 79 -11.7 Dallas Mavericks - 10.2 146 81 -7.8 21 New Jersey Nets 89 64 Los Angeles Clippers Miami Heat 62 124 78 -5.9 22 102 11.0 Phoenix Suns Atlanta Hawks 70 147 69 20.4 23 105 -7.3 San Antonio Spurs Sacramento Kings 72 135 84 -4.7 24 103 -9.8 Toronto Raptors Orlando Magic Golden State Warriors 119 72 25 Charlotte Bobcats 10 138 25.3 98 73 -20.0 -23.1 New Orleans Hornets 74 11 108 86 26 100 -5.9 Indiana Pacers 12 70 14.3 27 95 71 - 16.9 28 13 Detroit Pistons 147 64 31.8 Memphis Grizzlies 92 59 -2.6 Portland Trail Blazers Minnesota Timberwolves 14 127 64 10.7 29 95 67 -6.7 Cleveland Cavaliers Milwaukee Bucks 15 161 90 2.6 30 92 69 -2.0
Step by Step Solution
3.40 Rating (169 Votes )
There are 3 Steps involved in it
Using a statistical software package with default classes a histogram of Team ... View full answer

Get step-by-step solutions from verified subject matter experts