

Question: Construct a histogram, frequency polygon, and ogive for the data in Exercise 5. Data from 5 90 420 300 194 640 68 268 276 620
Data from 5
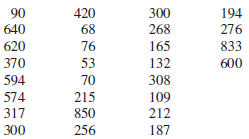
90 420 300 194 640 68 268 276 620 76 165 833 370 53 132 600 594 70 308 574 215 109 317 850 212 300 256 187
Step by Step Solution
★★★★★
3.38 Rating (167 Votes )
There are 3 Steps involved in it
1 Expert Approved Answer
Step: 1 Unlock

Frequency 12 10 8 2 0 Water fall Heights 5251855 18553185 3... View full answer
Question Has Been Solved by an Expert!
Get step-by-step solutions from verified subject matter experts
Step: 2 Unlock
Step: 3 Unlock
Document Format (2 attachments)
1597_6062c74d112e6_679222.pdf
180 KBs PDF File
1597_6062c74d112e6_679222.docx
120 KBs Word File