

Question: Develop a table of row percentages for the contingency table you set up in Exercise 2.76. Using these row percentages, construct a percentage frequency distribution
Develop a table of row percentages for the contingency table you set up in Exercise 2.76. Using these row percentages, construct a percentage frequency distribution of overall design quality rating for each of the United States, the Pacific Rim, and Europe. Illustrate these three frequency distributions using percentage pie charts and compare the distributions in a written report.
Based on the data in Table 2.23 (see page 100). This table gives the results of the J.D. Power initial quality study of 2014 automobiles. Each model is rated on overall mechanical quality and overall design quality on a scale from €œamong the best€ to €œthe rest€ (see the Scoring Legend).
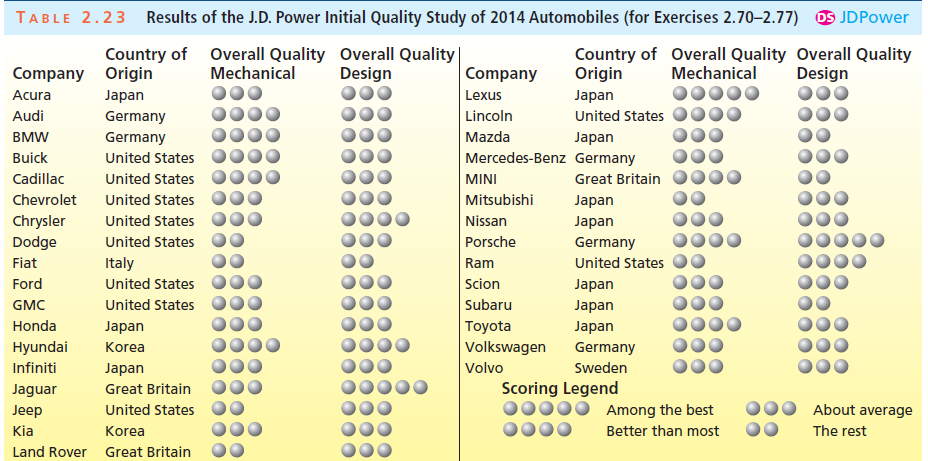
Results of the J.D. Power Initial Quality Study of 2014 Automobiles (for Exercises 2.702.77) OS JDPower TABLE 2.23 Country of Company Origin Overall Quality Overall Quality| Mechanical Country of Overall Quality Overall Quality Origin Mechanical Design Company Lexus Design Acura Japan Japan Audi Lincoln United States Germany Mazda BMW Germany Japan Buick United States Mercedes-Benz Germany Cadillac United States Great Britain MINI Chevrolet United States Mitsubishi Japan Chrysler Dodge United States Japan Nissan United States Porsche Germany Italy Fiat Ram United States Ford United States Scion Japan United States Subaru GMC Japan Toyota Volkswagen Honda Japan Japan Hyundai Korea Germany Infiniti Japan Volvo Sweden Scoring Legend Great Britain Jaguar Among the best About average United States Jeep The rest Kia Better than most Korea Land Rover Great Britain
Step by Step Solution
3.32 Rating (161 Votes )
There are 3 Steps involved in it
See the table in 276 Same observations as in 276 United States P... View full answer

Get step-by-step solutions from verified subject matter experts