

Question: Draw and compare two time series graphs for the number of homicides in the Chicago area. As of June 29 207 204 204 Homicides 451
Draw and compare two time series graphs for the number of homicides in the Chicago area.
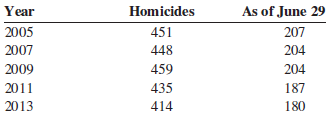
As of June 29 207 204 204 Homicides 451 448 Year 2005 2007 2009 2011 | 2013 459 435 414 187 180
Step by Step Solution
★★★★★
3.51 Rating (168 Votes )
There are 3 Steps involved in it
1 Expert Approved Answer
Step: 1 Unlock

Theres no way to tell if the crime ... View full answer
Question Has Been Solved by an Expert!
Get step-by-step solutions from verified subject matter experts
Step: 2 Unlock
Step: 3 Unlock
Document Format (2 attachments)
1597_6062c74d10e9c_679215.pdf
180 KBs PDF File
1597_6062c74d10e9c_679215.docx
120 KBs Word File