

Example 1.5 gave the accompanying data on violent crime on public college campuses in Florida during 2016
Question:
Example 1.5 gave the accompanying data on violent crime on public college campuses in Florida during 2016 (fbi.gov, retrieved February 6, 2018):
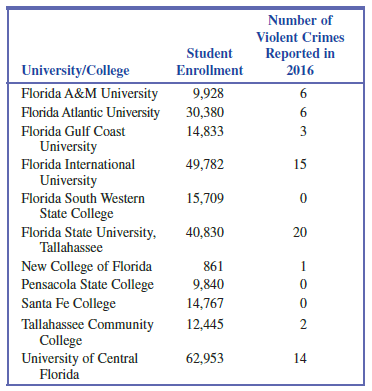
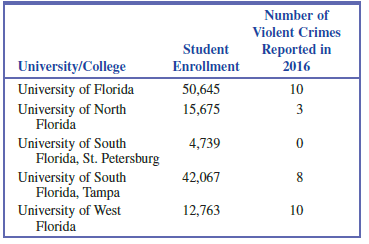
a. Construct a dotplot using the 16 observations on number of violent crimes reported. Which schools stand out from the rest?
b. One of the Florida schools has only 861 students and a few of the schools are quite a bit larger than the rest. Because of this, it might make more sense to consider a crime rate by calculating the number of violent crimes reported per 1000 students. For example, for Florida A&M University the violent crime rate would be 6/9928 (1000) = (0.001)(1000) = 1.0 Calculate the violent crime rate for the other 15 schools and then use those values to construct a dotplot. Do the same schools stand out as unusual in this dotplot?
c. Based on your answers from Parts (a) and (b), write a couple of sentences commenting on violent crimes reported at Florida universities and colleges in 2016.
Step by Step Answer:
a Three schools seem to stand out from the rest these being in increasing order of number of crimes ...View the full answer


Introduction To Statistics And Data Analysis
ISBN: 9781337793612
6th Edition
Authors: Roxy Peck, Chris Olsen, Tom Short
