

Fill in the blanks on the graph with the areas, the upper and lower limits of the
Question:
Fill in the blanks on the graph with the areas, the upper and lower limits of the Confidence Interval and the sample mean.
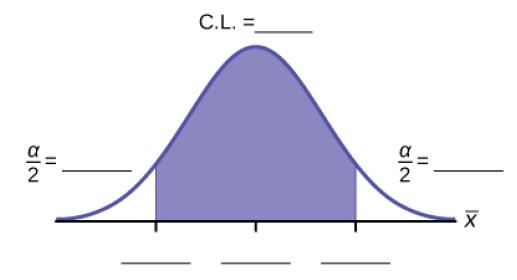
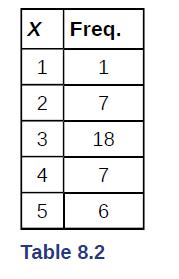
The data in Table 8.2 are the result of a random survey of 39 national flags (with replacement between picks) from various countries. We are interested in finding a confidence interval for the true mean number of colors on a national flag. Let X = the number of colors on a national flag.
Step by Step Answer:

This question has not been answered yet.
You can Ask your question!
Related Book For 

Introductory Business Statistics
ISBN: 202318
1st Edition
Authors: Alexander Holmes , Barbara Illowsky , Susan Dean
Question Posted:
