

Height, Weight, and BodyFat Figure 2.87 shows a bubble plot of height, weight, and body fat percentage
Question:
Height, Weight, and BodyFat Figure 2.87 shows a bubble plot of height, weight, and body fat percentage for a sample of $100 \mathrm{men}$, from the dataset BodyFat. The body fat percentage is indicated by the size of the bubble for each case.
(a) How many variables are shown in the scatterplot? Identify each as categorical or quantitative.
(b) Ignoring bubble size, does there appear to be a positive or negative relationship between height and weight?
(c) Do the bubbles tend to be larger on the top half of the scatterplot or the bottom half? Interpret this in context and in terms of the relevant variables.
(d) Body fat percentage depends on more than just height and weight. There are two cases who are about 66 inches tall, one weighing about 125 pounds and the other about 140 pounds. Which has the larger body fat percentage?
(e) There are two cases weighing about 125 pounds, one about 66 inches tall and the other about 67 inches tall. Which has a larger body fat percentage?
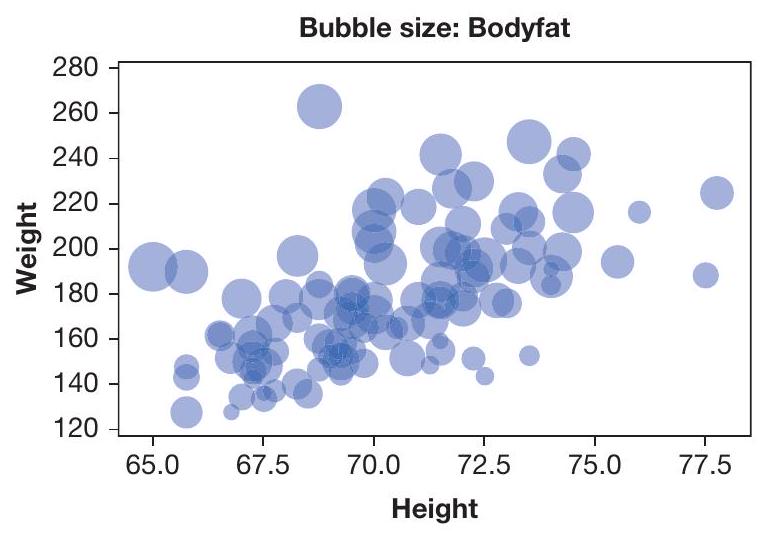
Figure 2.87 Height, weight, and body fat
(f) Does the person with the largest weight have a body fat percentage that is relatively large, relatively small, or pretty average?
(g) Does the person with the largest height have a body fat percentage that is relatively large, relatively small, or pretty average? How about the person with the third largest height?
(h) This particular sample included only males, but if we created a similar graph for a dataset including both males and females, indicate one way in which we could incorporate the fourth variable of gender in the graph.
Step by Step Answer:

This question has not been answered yet.
You can Ask your question!


Statistics, Enhanced Unlocking The Power Of Data
ISBN: 9781119308843
2nd Edition
Authors: Robin H Lock, Patti Frazer Lock, Kari Lock Morgan, Eric F Lock, Dennis F Lock
