

Question: Visualizing Football and Brain Size Exercise 2.143 introduces a study in which the number of years playing football and the size of the hippocampus in
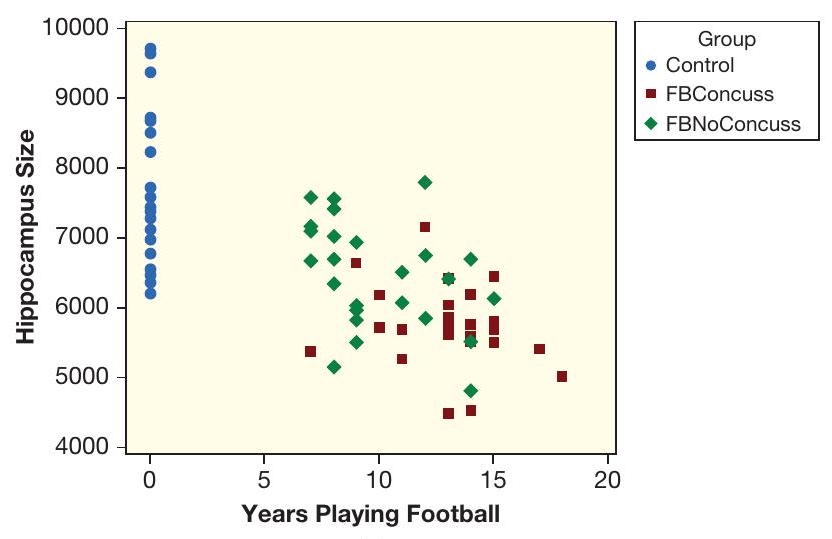
Visualizing Football and Brain Size Exercise 2.143 introduces a study in which the number of years playing football and the size of the hippocampus in the brain were recorded for each person in the study. There were three different groups in the study: football players who had been diagnosed with at least one concussion, football players who had never been diagnosed with a concussion, and a control group of people who had never played football. Figure 2.88 (a) shows a graph that incorporates all three of these variables.
(a) Identify each variable as quantitative or categorical.
(b) Why are all the blue dots stacked up on the left?
(c) Overall, does there appear to be a positive or negative association (or no association) between years playing football and hippocampus size?
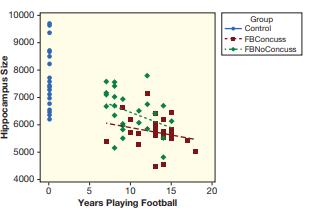
(d) Figure 2.88 (b) shows the same graph with regression lines for the two groups of football players. Which of the groups has the line that is lower on the graph? What does this tell us in the context of the three variables?
(e) Which of the groups has the line with the steeper slope?
(a)
(b)
Figure 2.88 Brain size, football experience, and concussions
Data From Exercise 2.143:
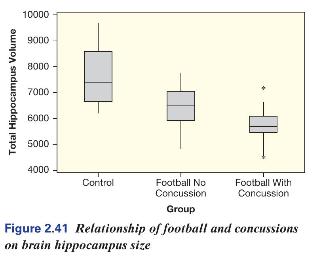
A recent study examined the relationship of football and concussions on hippocampus volume in the brain. The study included three groups with \(n=25\) in each group: heathy controls who had never played football, football players with no history of concussions, and football players with a history of concussions. Figure 2.41 shows side-by-side boxplots for total hippocampus volume, in \(\mu \mathrm{L}\), for the three groups.
Hippocampus Size 10000 9000 Group Control FBConcuss FBNoConcuss 8000 7000 6000 5000 4000 0 5 10 15 20 Years Playing Football
Step by Step Solution
3.38 Rating (173 Votes )
There are 3 Steps involved in it

Get step-by-step solutions from verified subject matter experts