

Question: Here is a scatterplot showing the regression line, 95% confidence intervals, and 95% prediction intervals, using 2015 and 2016 male unemployment data for a sample
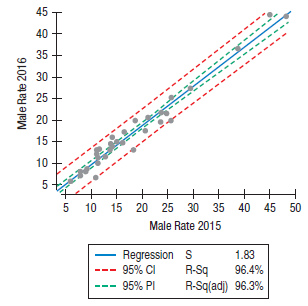
Here is a scatterplot showing the regression line, 95% confidence intervals, and 95% prediction intervals, using 2015 and 2016 male unemployment data for a sample of 33 nations. The response variable is the 2016-Male Rate, and the predictor variable is the 2015-Male Rate.
a) Explain the meaning of the 95% prediction intervals in this context.
b) Explain the meaning of the 95% confidence intervals in this context.
c) Using a statistics program, identify any unusual observations, and discuss their potential impact on the regression.
45 40 35 + 30 25 20 15 10 5 to 5 10 15 20 25 + + + 30 35 40 + + 45 50 Male Rate 2015 Regression s 95% CI 1.83 R-Sq R-Sqlad) 96.3% 96.4% 95% PI Male Rate 2016
Step by Step Solution
3.44 Rating (173 Votes )
There are 3 Steps involved in it
a The 95 prediction interval shows the interval of uncertainty f... View full answer

Get step-by-step solutions from verified subject matter experts