

Heres a bar chart of the data in Exercise 15: a) Compared to the pie chart in
Question:
Here’s a bar chart of the data in Exercise 15:
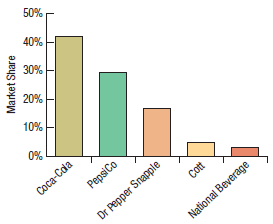
a) Compared to the pie chart in Exercise 15, which is better for displaying the relative portions of market share? Explain.
b) What is missing from this display that might make it misleading?
Fantastic news! We've Found the answer you've been seeking!
Step by Step Answer:
a The pie chart does a better ...View the full answer

Answered By
Carly Cimino
As a tutor, my focus is to help communicate and break down difficult concepts in a way that allows students greater accessibility and comprehension to their course material. I love helping others develop a sense of personal confidence and curiosity, and I'm looking forward to the chance to interact and work with you professionally and better your academic grades.
12+ Reviews
21+ Question Solved
Related Book For 

Business Statistics
ISBN: 9780133899122
3rd Canadian Edition
Authors: Norean D. Sharpe, Richard D. De Veaux, Paul F. Velleman, David Wright
Question Posted:
