

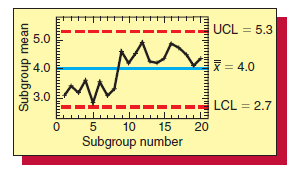
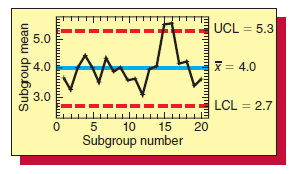
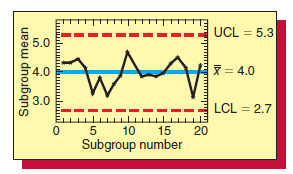
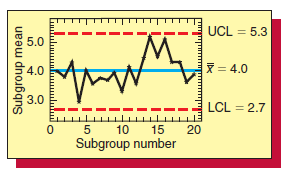
In an issue of Quality Progress, Gunter presents several control charts. Four of these charts are reproduced
Question:
Figure 16.17
a.
b.
c.
d.
Fantastic news! We've Found the answer you've been seeking!
Step by Step Answer:
Chart a Shows a run of 8 points below the center line followed ...View the full answer

Answered By
Aasif Najar
I have an experience of 2 years as a teacher, I am highly proficient in providing hands on experience on civil engineering concepts. I can teach students to learn the clear civil concepts.
Methodology
I believe in providing hands on experience rather than feeding students with lame bookish theories. I teach students with real life examples.
Currently I'm working as junior engineer at power development corporation where we deal with hydro power industry.
I have practical experience of verious Civil projects and also testing labs like road research and material testing laboratory,DIQCD, and I want share it with students to benefit them.
0 Reviews
10+ Question Solved
Related Book For 
Business Statistics In Practice Using Data Modeling And Analytics
ISBN: 9781259549465
8th Edition
Authors: Bruce L Bowerman, Richard T O'Connell, Emilly S. Murphree
Question Posted:
