

Question: In the article Accelerating Improvement published in Quality Progress, Gaudard, Coates, and Freeman describe a restaurant that caters to business travelers and has a self-service
Figure 1.10
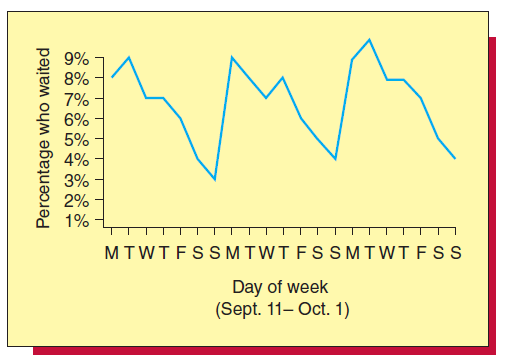
9% 8% 7% 6% 5% 3% 2% 1% MTWTFSSMTWT FSS MTWT FSS Day of week (Sept. 11- Oct. 1) Percentage who waited
Step by Step Solution
★★★★★
3.44 Rating (176 Votes )
There are 3 Steps involved in it
1 Expert Approved Answer
Step: 1 Unlock

The time series plot shows that the earli... View full answer
Question Has Been Solved by an Expert!
Get step-by-step solutions from verified subject matter experts
Step: 2 Unlock
Step: 3 Unlock