

Literacy Rate Figure 2.39 gives a boxplot showing the literacy rate of the countries of the world.
Question:
Literacy Rate Figure 2.39 gives a boxplot showing the literacy rate of the countries of the world.
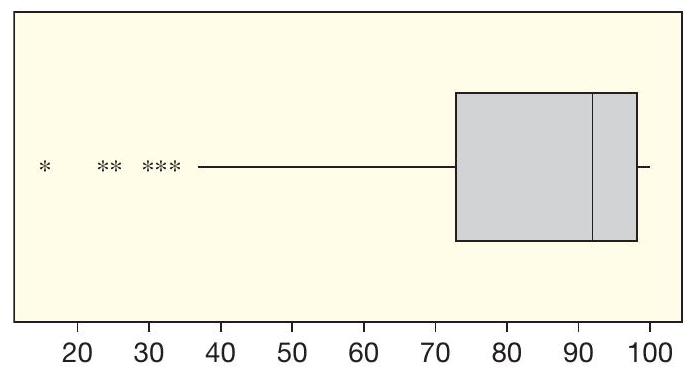
Figure 2.39 Literacy rate for countries of the world
(a) Describe the shape of the distribution.
(b) The middle half of all literacy rates are between approximately what two values?
(c) Approximate the five-number summary from the boxplot.
(d) Some countries did not have data on literacy rate available from the World Bank. Do you suspect the true median is higher or lower than that shown on the boxplot from the available data? Why?
Fantastic news! We've Found the answer you've been seeking!
Step by Step Answer:

Answered By
Dorcas Juliet
I am a proficient tutor and writer with over 4 years experience, I can deliver A+ works in all fields related to business and economics subject. Kindly hire me for excellent papers
10+ Reviews
51+ Question Solved
Related Book For 

Statistics, Enhanced Unlocking The Power Of Data
ISBN: 9781119308843
2nd Edition
Authors: Robin H Lock, Patti Frazer Lock, Kari Lock Morgan, Eric F Lock, Dennis F Lock
Question Posted:
