

Question: Numbeo.com collects data from users in cities around the world on prices of a basket of goods and services and uses these data to determine
Numbeo.com collects data from users in cities around the world on prices of a basket of goods and services and uses these data to determine a cost of living index. This index scales New York City as 100 and expresses the cost of living in other cities as a percentage of the New York cost. For example, in 2009, the cost of living index in Paris was 127.8, which means that it cost 27.8% more to live in Paris than New York that year. The scatterplot shows the index for 2017 plotted against the 2009 index for the 40 cities worldwide on which Numbeo collected data in both years.
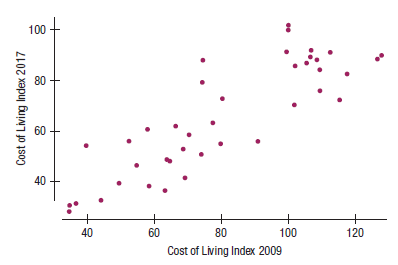
a) Describe the association between cost of living indices in 2009 and 2017.
b) The R2 for the regression equation is 0.732. Interpret the value of R2.
c) Find the correlation.
d) Using the data provided, find the least squares fit of the 2017 index to the 2009 index.
e) Predict the 2017 cost of living index of Paris and find its residual.
100 + 80 60 40 + 60 + 100 40 80 120 Cost of Living Index 2009 Cost of Living Index 2017
Step by Step Solution
3.37 Rating (166 Votes )
There are 3 Steps involved in it
a The association between the cost of living in 2017 and 2009... View full answer

Get step-by-step solutions from verified subject matter experts