

Question: Predicting runs scored in baseball. Consider a multipleregression model for predicting the total number of runs scored by a Major League Baseball (MLB) team during
Predicting runs scored in baseball. Consider a multipleregression model for predicting the total number of runs scored by a Major League Baseball (MLB) team during a season. Using data on number of walks (x1), singles (x2), doubles (x3), triples (x4), home runs (x5), stolen bases (x6), times caught stealing (x7), strike outs (x8), and ground outs
(x9) for each of the 30 teams during the 2014 MLB season, a 1st-order model for total number of runs scored (y) was fit.
The results are shown in the accompanying Minitab printout.
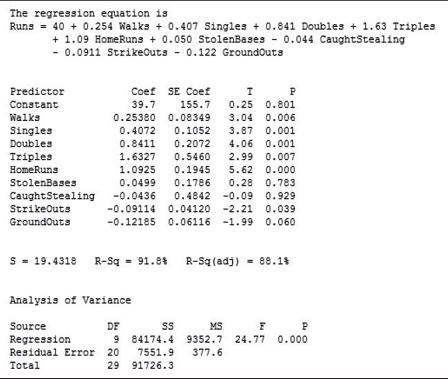
a. Write the least squares prediction equation for y = total number of runs scored by a team during the 2014 season.
b. Give practical interpretations of the beta estimates.
c. Conduct a test of H0: b7 = 0 against Ha: b7 6 0 at a = .05. Interpret the results.
d. Form a 95% confidence interval for b5. Interpret the results.
e. Predict the number of runs scored in 2014 by your favorite Major League Baseball team. How close is the predicted value to the actual number of runs scored by your team? (Note: You can find data on your favorite team on the Internet at www.majorleaguebaseball.com.)
The regression equation is Runs 40+ 0.254 Walks +0.407 Singles +0.841 Doubles +1.63 Triples +1.09 HomeRuns + 0.050 StolenBases -0.044 Caught Stealing -0.0911 StrikeOuts 0.122 GroundOuts Predictor Coef SE Coef I P Constant 39.7 Walks 0.25380 155.7 0.08349 0.25 0.801 3.04 0.006 Singles 0.4072 Doubles 0.8411 Triples 1.6327 0.1052 3.87 0.001 0.2072 4.06 0.001 0.5460 2.99 0.007 HomeRuns 1.0925 0.1945 5.62 0.000 StolenBases Caught Stealing 0.0499 -0.0436 0.1786 0.28 0.783 StrikeOuts -0.09114 GroundOuts -0.12185 0.4842 -0.09 0.929 0.04120 -2.21 0.039 0.06116 -1.99 0.060 S = 19.4318 R-Sq = 91.8% Analysis of Variance Source R-Sq (adj) 88.1% Regression DF SS 9 84174.4 MS 9352.7 24.77 E P 0.000 7551.9 377.6 29 91726.3 Residual Error 20 Total
Step by Step Solution
There are 3 Steps involved in it

Get step-by-step solutions from verified subject matter experts