

Question: Sometimes when we create a stem-and-leaf plot, we get too many leaves per stem to give a good representation of the data. In such a
Sometimes when we create a stem-and-leaf plot, we get too many leaves per stem to give a good representation of the data. In such a case, we can further split the data space for each stem equally. Suppose 100 CPA firms are surveyed to determine how many audits they perform over a certain time. In this case, the best representation of the data is given by splitting each stem into five ranges. This results in the stem-and-leaf plot shown. The first stem, 1, has been split into five, the first of which contains data in the range 10 to 11 inclusive (and there are no data points in this range), the second in the range 12 to 13, the third in the range 14 to 15, the fourth in the range 16 to 17 and the fifth in the range 18 to 19. Similarly, the other stems have been divided into five ranges. This method is similar to how we define intervals for histograms. What can you learn from this plot about the number of audits being performed by these firms?
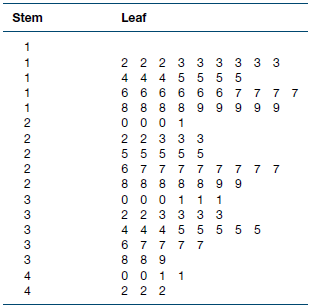
Stem Leaf 2 2 2 3 3 4 4 4 55 6 6 6 6 6 8 8 8 8 9 0 0 0 1 3 3 3 3 5 5 2 2 3 3 3 55 5 5 5 7 7 7 6 7 7 7 8 8 8 8 8 3 3 2 2 3 4 4 4 5 5 6 7 7 7 7 8 8 9 3 5 5 5 2 2 2 222 2232 333 44
Step by Step Solution
3.51 Rating (161 Votes )
There are 3 Steps involved in it
The fewest number of audits is 12 and the ... View full answer

Get step-by-step solutions from verified subject matter experts