

Speeds of cars were measured as they passed one point on a road to study whether traffic
Question:
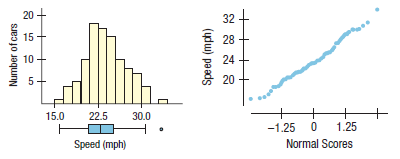
Speeds of cars were measured as they passed one point on a road to study whether traffic speed controls were needed. Here’s a histogram and normal probability plot of the measured speeds. Is a Normal model appropriate for these data? Explain.
Fantastic news! We've Found the answer you've been seeking!
Step by Step Answer:
Yes a Normal model appears appropri...View the full answer

Answered By
Branice Buyengo Ajevi
I have been teaching for the last 5 years which has strengthened my interaction with students of different level.
1+ Reviews
10+ Question Solved
Related Book For 

Business Statistics
ISBN: 9780133899122
3rd Canadian Edition
Authors: Norean D. Sharpe, Richard D. De Veaux, Paul F. Velleman, David Wright
Question Posted:
