

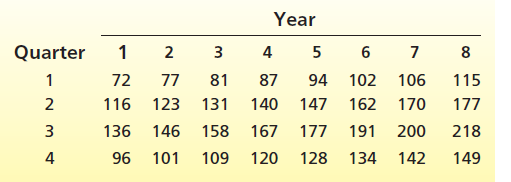
Table 15.24 gives quarterly sales (in thousands of cases) of Tiger Sports Drink over the previous eight
Question:
Table 15.24
Fantastic news! We've Found the answer you've been seeking!
Step by Step Answer:
A data plot of Tiger Sports Drink sales is The plot suggests there is a linear trend and increasing quarterly seasonal variability A plot of lnsales s...View the full answer

Answered By
Rukhsar Ansari
I am professional Chartered accountant and hold Master degree in commerce. Number crunching is my favorite thing. I have teaching experience of various subjects both online and offline. I am online tutor on various online platform.
4+ Reviews
17+ Question Solved
Related Book For 
Business Statistics In Practice Using Data Modeling And Analytics
ISBN: 9781259549465
8th Edition
Authors: Bruce L Bowerman, Richard T O'Connell, Emilly S. Murphree
Question Posted:
