

Question: Table 5.5 reports that the 95% confidence interval for the comparison of mean corn size at 12 months between the corn plaster and scalpel groups
Table 5.5 reports that the 95% confidence interval for the comparison of mean corn size at 12 months between the corn plaster and scalpel groups is: −1.7 to −0.2 mm.
Which (if any) of the following statements is CORRECT?
A. The above 95% confidence interval definitely contains the true population mean difference in corn size at 12 months between the corn plaster and scalpel groups.
B. The 95% confidence interval is calculated as ±3 standard errors away from the mean difference.
C. There is a probability of 0.95 that the population mean difference in corn size at 12 months between the corn plaster and scalpel groups lies between −1.7 and −0.2 mm.
D. The 95% confidence interval does not contain the true population mean difference in corn size at 12 months between the corn plaster and scalpel groups.
E. The above 95% confidence interval is likely to contain the true population mean difference in corn size at 12 months between the corn plaster and scalpel groups.
Table 5.5
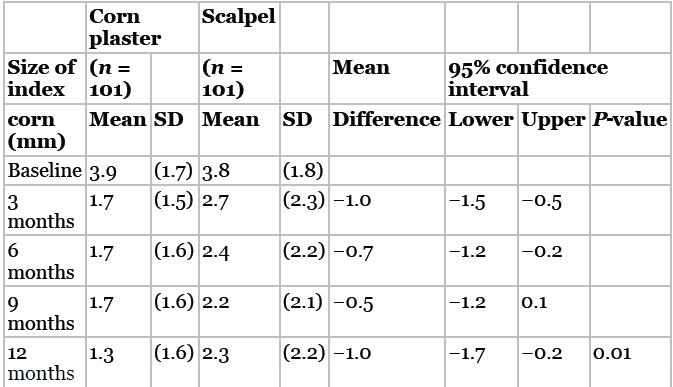
Corn plaster Scalpel Size of (n = (n = Mean 95% confidence index 101) 101) interval corn Mean SD Mean SD SD Difference Lower Upper P-value (mm) Baseline 3.9 (1.7) 3.8 (1.8) 3 1.7 (1.5) 2.7 (2.3) -1.0 -1.5 -0.5 months 6 1.7 (1.6) 2.4 (2.2) -0.7 -1.2 -0.2 months 9 1.7 (1.6) 2.2 (2.1) -0.5 -1.2 0.1 months 12 1.3 (1.6) 2.3 (2.2) -1.0 -1.7 -0.2 0.01 months
Step by Step Solution
There are 3 Steps involved in it
E A is incorrect because the result is not definitely The CI may contain the true value but we ... View full answer

Get step-by-step solutions from verified subject matter experts