

The figure on the next page appeared in the paper ?EDTA-Extractable Copper, Zinc, and Manganese in Soils
Question:
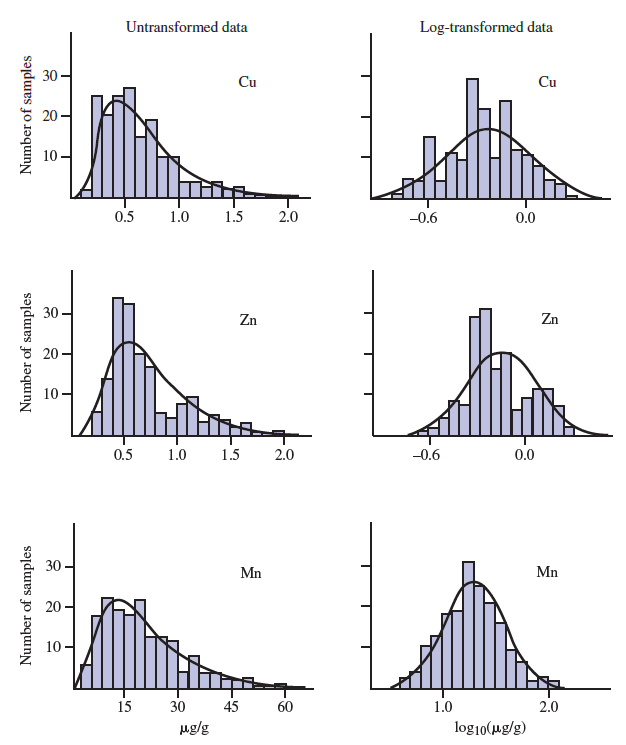
The figure on the next page appeared in the paper ?EDTA-Extractable Copper, Zinc, and Manganese in Soils of the Canterbury Plains? (New Zealand Journal of Agricultural Research [1984]: 207?217). A large number of topsoil samples were analyzed for manganese (Mn), zinc (Zn), and copper (Cu), and the resulting data were summarized using histograms. The investigators transformed each data set using logarithms in an effort to obtain more nearly symmetric distributions of values. Do you think the transformations were successful? Explain.
Fantastic news! We've Found the answer you've been seeking!
Step by Step Answer:
Yes In each case the trans...View the full answer

Answered By
RADHIKA MEENAKAR
I am a qualified indian Company Secretary along with Masters in finance with over 6 plus years of professional experience. Apart from this i am a certified accounts and finance tutor on many online platforms.
My Linkedin profile link is here https://www.linkedin.com/in/radhika-meenakar-88b9808a/
12+ Reviews
22+ Question Solved
Related Book For 

Introduction To Statistics And Data Analysis
ISBN: 9781337793612
6th Edition
Authors: Roxy Peck, Chris Olsen, Tom Short
Question Posted:
