

The graph shows Canadian wheat exports in dollars, from January 2006 to May 2009, in light blue,
Question:
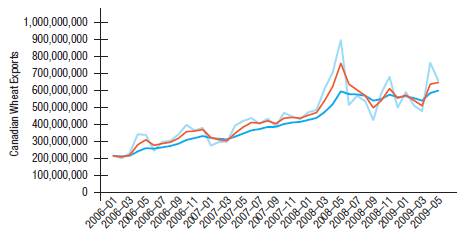
The graph shows Canadian wheat exports in dollars, from January 2006 to May 2009, in light blue, together with two exponential smoothings. One exponential smoothing has the
smoothing parameter α = 0.5, and the other has α = 0.2.
CANSIM
Table 228-0001—Merchandise imports and exports, by major groups and principal trading areas for all countries, monthly [dollars].)
a) Which exponential smoothing corresponds to the graph in orange?
b) Which exponential smoothing corresponds to the graph in dark blue?
c) Canadian wheat exports peaked in May 2008. Which exponential smoothing is affected for a longer period of time after this peak?
Step by Step Answer:
a The exponential smoothing with 05 corresponds to the orange graph since it i...View the full answer


Business Statistics
ISBN: 9780133899122
3rd Canadian Edition
Authors: Norean D. Sharpe, Richard D. De Veaux, Paul F. Velleman, David Wright
