

The Real Property Association of Canada surveyed 82 office buildings as to their water usage and graphed
Question:
The Real Property Association of Canada surveyed 82 office buildings as to their water usage and graphed the number of litres of water used per square foot of office space per year (L/ft2/yr) for each building (actual data, not normalized for type of building).
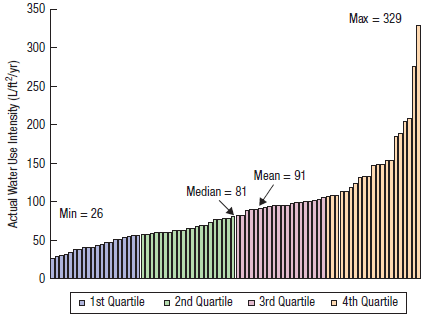
a) Construct a histogram of this data and identify the mode of the histogram.
b) What is implied by the fact that the median given on the diagram is lower than the mean? How does this correspond to features in your histogram?
c) By reading the numbers off the vertical axis, estimate the quartiles and identify how many buildings are outliers.
Fantastic news! We've Found the answer you've been seeking!
Step by Step Answer:
a Since there are 82 data values we use 7 bins since 26 64 an...View the full answer

Answered By
Ajay Negi
Hi, I've completed my degree in engineering (Information Technology) from an NIT. Currently working as a software engineer. Wish to impart quality education to the future generation.
2+ Reviews
10+ Question Solved
Related Book For 

Business Statistics
ISBN: 9780133899122
3rd Canadian Edition
Authors: Norean D. Sharpe, Richard D. De Veaux, Paul F. Velleman, David Wright
Question Posted:
