

Question: The table shown below comes from a study reported by Larry Bartels (2004), a political scientist. The table displays the mean and standard deviation (shown
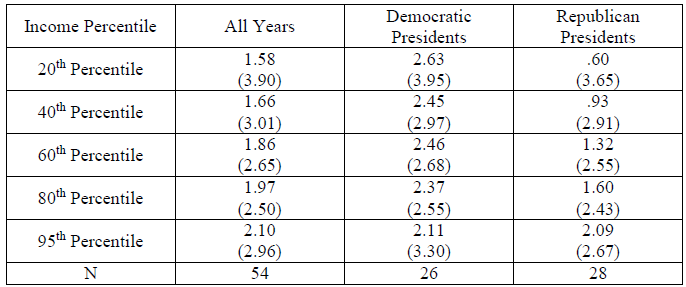
1. What do the means in the All Years column tell you about annual real income growth as related to income percentile?
2. What do the standard deviations in the All Years column tell you about fluctuations in annual income growth as related to income percentile?
3. What do the means in the Democratic President column and Republican Presidents column tell you about annual real income growth as related to income percentile and whether the president was a Democratic or a Republican?
4. Was the annual income growth rate more variable when a Democrat or when a Republican occupied the White House?
Democratic Republican Presidents Income Percentile All Years Presidents 2.63 1.58 .60 20th Percentile (3.90) (3.95) (3.65) 1.66 2.45 .93 40th Percentile (3.01) (2.97) (2.91) 1.32 1.86 2.46 60th Percentile (2.68) 2.37 (2.55) 1.60 (2.65) 1.97 80th Percentile (2.50) (2.55) 2.11 (2.43) 2.09 2.10 95th Percentile (2.96) 54 (3.30) 26 (2.67) 28
Step by Step Solution
3.47 Rating (167 Votes )
There are 3 Steps involved in it
1 Annual income growth increased fairly smoothly from the 20th percentile to the 95th percen... View full answer

Get step-by-step solutions from verified subject matter experts