

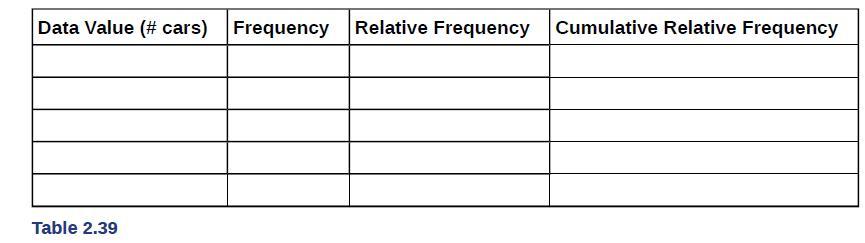
Question: To construct the histogram for the data in Table 2.39, determine appropriate minimum and maximum x and y values and the scaling. Sketch the histogram.
To construct the histogram for the data in Table 2.39, determine appropriate minimum and maximum x and y values and the scaling. Sketch the histogram. Label the horizontal and vertical axes with words. Include numerical scaling.
Step by Step Solution
★★★★★
3.37 Rating (156 Votes )
There are 3 Steps involved in it
1 Expert Approved Answer
Step: 1 Unlock

Question Has Been Solved by an Expert!
Get step-by-step solutions from verified subject matter experts
Step: 2 Unlock
Step: 3 Unlock