Use Table B in your textbook to find the critical t values for the following hypothesis tests:

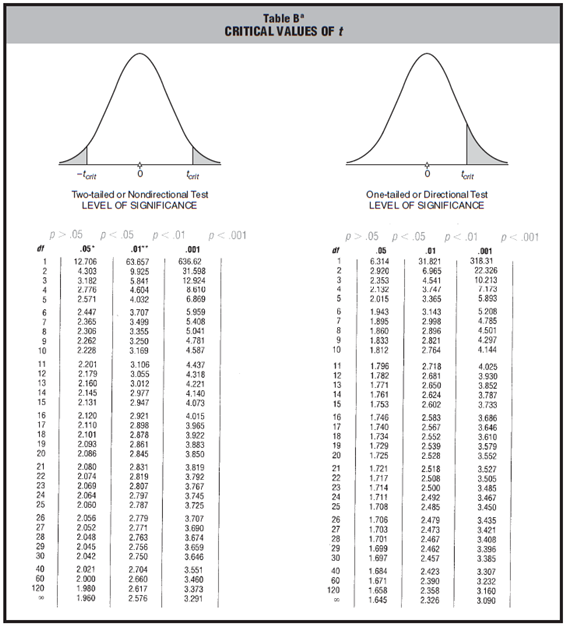
1. One-tailed test, upper tail critical, α = .01, df = 15
2. Two-tailed test , α = .05, df = 112
3. Two-tailed test, α = .01, df = 5
4. Tne-tailed test, lower tail critical, α = .05, df = 68
Transcribed Image Text:
Table B CRITICAL VALUES OF t -larit orit forit Two-tailed or Nondirectional Test LEVEL OF SIGNIFICANCE One-tailed or Directional Test LEVEL OF SIGNIFICANCE p>.05 p<.05 p<.01 p<.001 p>.05 p<.05 p<.01 p<.001 df .05 .01 .001 .05 01 .001 318.31 22.326 10.213 31.821 6.965 4.541 3.14/ 3.365 12.706 4.303 3.182 2.776 2.571 63.657 9.925 5.841 4.604 4.032 636.62 31.508 12.924 8610 6.869 6.314 2.920 2.353 2.132 2.015 7.173 5.893 3.707 3.499 3.355 3.250 3.169 5 208 4.785 4,501 4.297 4.144 2.447 2.365 2.305 2.262 2.228 5.959 5.408 5.041 4.781 4.587 1.943 1.895 1.860 1.833 1.812 3.143 2.998 2.896 2.821 2.764 10 10 2.201 2.179 2.160 2.145 2.131 11 12 13 3.106 3.055 3.012 2.977 2.947 4.437 4.318 4.221 4.140 4.073 1.796 1.782 1.771 1.761 1.753 11 12 13 2.718 2.681 2.650 2.624 2.602 4.025 3.930 3.852 3.787 3.733 14 14 15 15 16 17 18 19 20 2.120 2.110 2.101 2.093 2.086 2.921 2.898 2.878 2.861 2.845 4.015 16 17 18 19 20 1.746 1.740 1.734 1.729 1.725 2.583 2.567 2.552 2.539 2.528 3.686 3.646 3.6 3.579 3.552 3.965 3.922 3.883 3.850 21 2.080 2.074 2.069 2.064 2.060 2.831 2.819 2.807 2.797 2.787 3.819 3.792 3.767 3.745 3.725 1.721 2.518 2.508 2.500 2.492 2.485 3.527 3.505 3.485 3.467 3.450 1.717 23 24 25 1.714 1.711 1.708 26 27 28 29 30 2.056 2.779 2.771 2.763 2.756 2.750 3.707 3.690 3.674 3.659 3.646 1.706 1.703 1.701 1.699 1.697 2.479 2.473 2.467 2.462 2.457 3.435 3.421 3.408 3.396 3.385 3.307 3 232 2.052 2.048 2.045 2.042 40 60 120 2.021 2.000 1.980 1.960 2.704 2.660 2.617 2.576 3.551 3.460 3.373 3.291 40 60 120 1.684 1.671 1.658 1.645 2.423 2.390 2.358 2.326 3.160 3.090