

Question: Use the data from the David County science competition supplied in Exercise 2.6. Construct a bar graph that shows the county-wide population percentage of students
Use the data from the David County science competition supplied in Exercise 2.6. Construct a bar graph that shows the county-wide population percentage of students at each school.
Exercise 2.6.
David County has six high schools. Each school sent students to participate in a county-wide science competition. Table 2.38 shows the percentage breakdown of competitors from each school, and the percentage of the entire student population of the county that goes to each school. Construct a bar graph that shows the population percentage of competitors from each school.
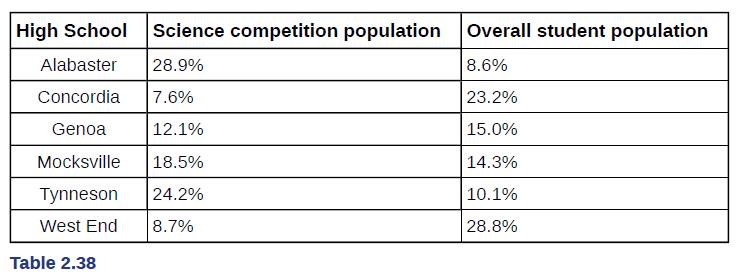
High School Science competition population Overall student population Alabaster 28.9% 8.6% Concordia 7.6% 23.2% Genoa 12.1% 15.0% Mocksville 18.5% 14.3% Tynneson 24.2% 10.1% West End 8.7% 28.8% Table 2.38
Step by Step Solution
3.35 Rating (155 Votes )
There are 3 Steps involved in it

Get step-by-step solutions from verified subject matter experts