

Question: Using the data from Mrs. Ramirezs math class supplied in Exercise 2.4, construct a bar graph showing the percentages. Exercise 2.4, The students in Ms.
Using the data from Mrs. Ramirez’s math class supplied in Exercise 2.4, construct a bar graph showing the percentages.
Exercise 2.4,
The students in Ms. Ramirez’s math class have birthdays in each of the four seasons. Table 2.37 shows the four seasons, the number of students who have birthdays in each season, and the percentage (%) of students in each group. Construct a bar graph showing the number of students.
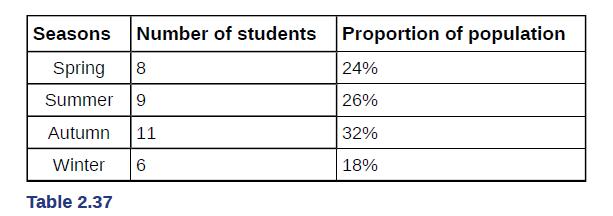
Seasons Number of students Proportion of population Spring 8 24% Summer 9 26% Autumn 11 32% 18% Winter 6 Table 2.37
Step by Step Solution
★★★★★
3.45 Rating (148 Votes )
There are 3 Steps involved in it
1 Expert Approved Answer
Step: 1 Unlock

Question Has Been Solved by an Expert!
Get step-by-step solutions from verified subject matter experts
Step: 2 Unlock
Step: 3 Unlock