

Question: We have seen that we can use a bubble plot to show a third quantitative variable on a scatterplot. Another way to show three quantitative
We have seen that we can use a bubble plot to show a third quantitative variable on a scatterplot. Another way to show three quantitative variables together is to use a 3-dimensional scatterplot, such as the one showing petal length, petal width, and sepal length in Figure 2.95. In this case, which variable is on the vertical axis? Which color dots are highest up (meaning they have the largest values for that variable)?
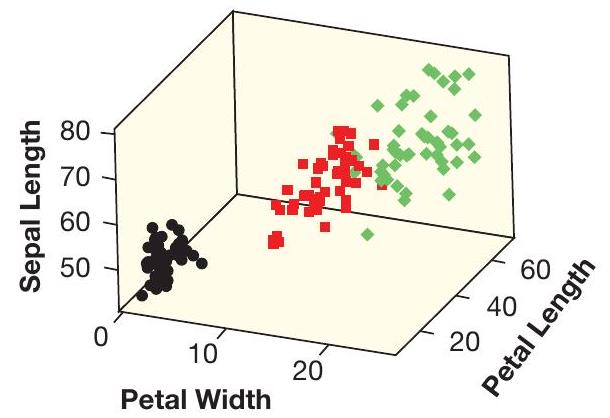
Figure 2.95 A 3-dimensional scatterplot
Sepal Length 80 70 09 650 40 60 Petal Length 0 20 10 20 Petal Width
Step by Step Solution
There are 3 Steps involved in it
1 Expert Approved Answer
Step: 1 Unlock

Question Has Been Solved by an Expert!
Get step-by-step solutions from verified subject matter experts
Step: 2 Unlock
Step: 3 Unlock