

Question: When it sends out its fundraising letter, a philanthropic organization typically gets a return from about 5% of the people on its mailing list. To
When it sends out its fundraising letter, a philanthropic organization typically gets a return from about 5% of the people on its mailing list. To see what the response rate might be for future appeals, it did a simulation using samples of size 20, 50, 100, and 200. For each sample size, it simulated 1000 mailings with success rate p = 0.05 and constructed the histogram of the 1000 sample proportions shown below. Explain how these histograms demonstrate what the Central Limit Theorem says about the sampling distribution model for sample proportions. Be sure to talk about shape, centre, and spread.
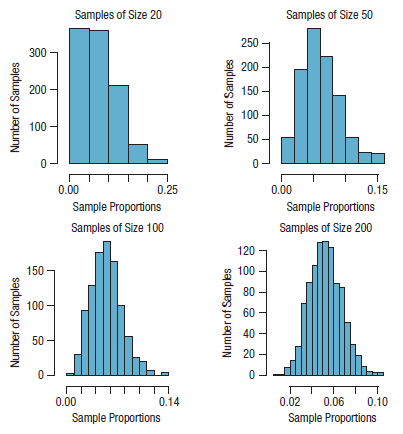
Samples of Size 20 Samples of Size 50 250 300 200 200 150 100 100 50 0.00 0.25 0.00 0.15 Sample Proportions Sample Proportions Samples of Size 100 Samples of Size 200 120 150 100 - 08 60 100 40 50 20 0.00 0.14 0.02 0.06 0.10 Sample Proportions Sample Proportions Number of Samples Number of Samples Number of Samples Number of Samples
Step by Step Solution
3.54 Rating (168 Votes )
There are 3 Steps involved in it
All of the histograms are centred around p ... View full answer

Get step-by-step solutions from verified subject matter experts