

Question: You should have found that the confidence interval when utilizing the paired structure of the data was narrower than the confidence interval ignoring this structure
You should have found that the confidence interval when utilizing the paired structure of the data was narrower than the confidence interval ignoring this structure (this will generally be the case, and is the primary reason for pairing). How else could we change the width of the confidence interval? More specifically, for each of the following changes, would the width of the confidence interval likely increase, decrease, or remain the same?
(a) Increase the sample size.
(b) Simulate more bootstrap samples.
(c) Decrease the confidence level from \(99 \%\) to \(95 \%\).
Pertain to a 2015 study which took a Swedish family that ate a conventional diet (non-organic), and then had them eat only organic for two weeks. Pesticide concentrations for several different pesticides were measured in \(\mu \mathrm{g} / \mathrm{g}\) creatinine by testing morning urine. Multiple measurements were taken for each person before the switch to organic foods, and then again after participants had been eating organic for at least one week. The results are pretty compelling, and are summarized in a short video which as of this writing has had over 30 million views online. The data are visualized in Figure 3.31 for eight different detected pesticides, and can be found in Organic Effect. How do pesticide levels in the body differ after eating organic versus non-organic?
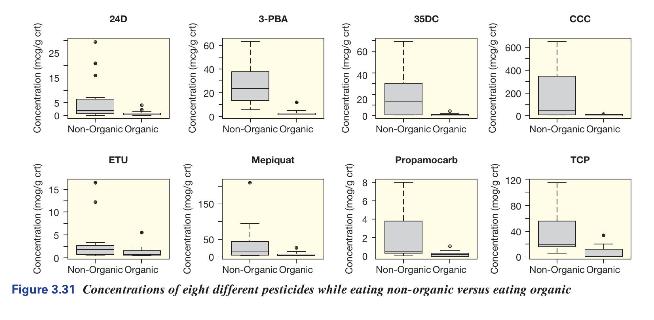
Concentration (mog/g crt) 5 15 10 Concentration (mcg/g crt) 50 15 15 25 25 Non-Organic Organic ETU 24D 150 50 Concentration (mog/g crt) 50 0 8 Concentration (mcg/g crt) 0 40 20 3-PBA Non-Organic Organic Mepiquat Concentration (mog/g crt) 60 40 Concentration (mcg/g crt) 35DC 20 0 Non-Organic Organic Propamocarb 600 Concentration (mcg/g crt) 400 200 0 Non-Organic Organic Non-Organic Organic Non-Organic Organic Non-Organic Organic Non-Organic Organic Figure 3.31 Concentrations of eight different pesticides while eating non-organic versus eating organic 120 80 TCP Concentration (mog/g crt) 0 40 CCC
Step by Step Solution
3.39 Rating (155 Votes )
There are 3 Steps involved in it

Get step-by-step solutions from verified subject matter experts