

Question: The Organic Effect This Exercise pertains to a 2015 study1 which took a Swedish family that ate a conventional diet (non-organic), and then had them
The Organic Effect This Exercise pertains to a 2015 study1 which took a Swedish family that ate a conventional diet (non-organic), and then had them eat only organic for two weeks. Pesticide concentrations for several different pesticides were measured in µg/g creatinine by testing morning urine. Multiple measurements2 were taken for each person before the switch to organic foods, and then again after participants had been eating organic for at least one week. The results are pretty compelling and are summarized in a short video3 which as of this writing has had over 30 million views online. The data are visualized in Figure 1 for eight different detected pesticides and can be found in OrganicEffect. How do pesticide levels in the body differ after eating organic versus non-organic?
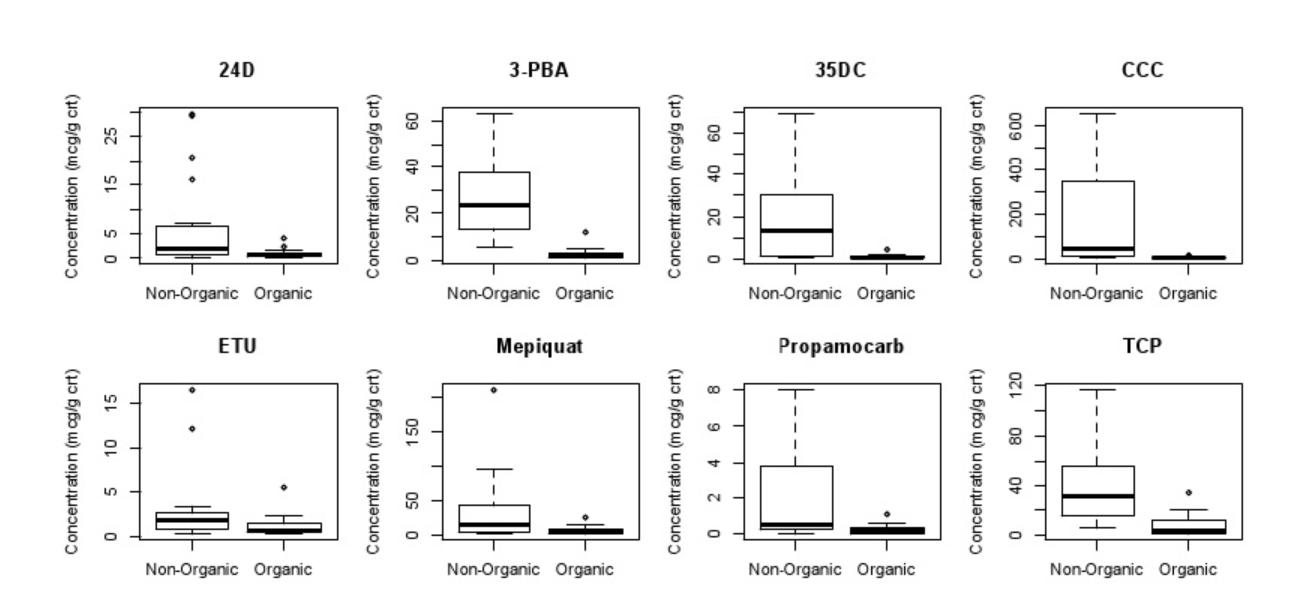
Non-Organic Organic Non-Organic Organic Non-Organic Organic Non-Organic Organic Concentration (mcg/g crt) 5 10 Concentration (mcg/g crt) 0 50 15 150 Concentration (mcg/g crt) 02 [1]+ 6 8 Concentration (mcg/g crt) 80 120 ETU Mepiquat Propamocarb TCP Non-Organic Organic Non-Organic Organic Non-Organic Organic Non-Organic Organic Concentration (mcg/g crt) 05 15 25 Concentration (mcg/g crt) 20 40 60 0 Concentration (mcg/g cit) 0 20 40 60 Concentration (mcg/g crt) 200 400 600 24D 3-PBA 35DC CCC
Step by Step Solution
3.50 Rating (157 Votes )
There are 3 Steps involved in it
Solution a Increase sample size Increasing sample size decrea... View full answer

Get step-by-step solutions from verified subject matter experts