

A heat probe is attached to the heat exchanger of a heating system. The temperature T (in
Question:
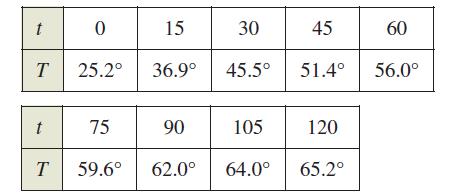
A heat probe is attached to the heat exchanger of a heating system. The temperature T (in degrees Celsius) is recorded t seconds after the furnace is started. The results for the first 2 minutes are recorded in the table.
(a) Use the regression capabilities of a graphing utility to find a model of the form ![]() for the data.
for the data.
(b) Use a graphing utility to graph T1.
(c) A rational model for the data is
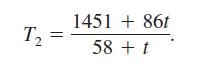
Use a graphing utility to graph T2.
![]() (d) Find T1 (0) and T2(0).
(d) Find T1 (0) and T2(0).
(e) Find![]()
(f) Interpret the result in part (e) in the context of the problem. Is it possible to do this type of analysis using T1? Explain.
Fantastic news! We've Found the answer you've been seeking!
Step by Step Answer:
a b c d e f No The ...View the full answer

Answered By
Utsab mitra
I have the expertise to deliver these subjects to college and higher-level students. The services would involve only solving assignments, homework help, and others.
I have experience in delivering these subjects for the last 6 years on a freelancing basis in different companies around the globe. I am CMA certified and CGMA UK. I have professional experience of 18 years in the industry involved in the manufacturing company and IT implementation experience of over 12 years.
I have delivered this help to students effortlessly, which is essential to give the students a good grade in their studies.
2+ Reviews
10+ Question Solved
Related Book For 

Question Posted:
