

Sketch the graph of the equation by point plotting. y 1 x + 2
Question:
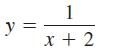
Sketch the graph of the equation by point plotting.
Fantastic news! We've Found the answer you've been seeking!
Step by Step Answer:
y X y 1 x 2 6 14 ...View the full answer

Answered By
Kripa Susan Luke
I am a BTech graduate and had worked as a Software Engineer for a reputed firm. Currently I'm preparing for government exams, so I always try to keep myself updated with general knowledge. I've a very good academic history. And now I'm also giving home tuition to my neighbour kids.
0 Reviews
10+ Question Solved
Related Book For 

Question Posted:
