

Question: The function shown in the graph below is increasing on the interval [1,4]. The interval will be divided into 12 subintervals. (a) What are the
The function shown in the graph below is increasing on the interval [1,4]. The interval will be divided into 12 subintervals.
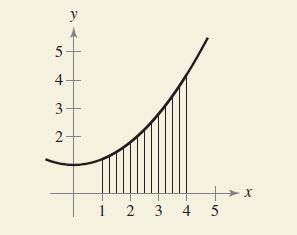
(a) What are the left endpoints of the first and last subintervals?
(b) What are the right endpoints of the first two subintervals?
(c) When using the right endpoints, do the rectangles lie above or below the graph of the function?
(d) What can you conclude about the heights of the rectangles when the function is constant on the given interval?
5 4 3 2 +x 1 2 3 4 5
Step by Step Solution
3.41 Rating (164 Votes )
There are 3 Steps involved in it
a Left endpoint of first subinterval is 1 Left end... View full answer

Get step-by-step solutions from verified subject matter experts