

The graph of the eight curve is shown below. (a) Explain how you could use a graphing
Question:
The graph of the eight curve![]()
is shown below.
(a) Explain how you could use a graphing utility to graph this curve.
(b) Use a graphing utility to graph the curve for various values of the constant a. Describe how a affects the shape of the curve.
(c) Determine the points on the curve at which the tangent line
is horizontal.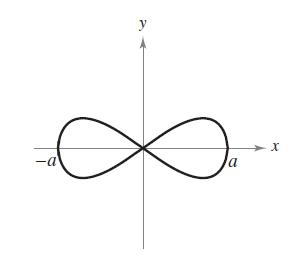
Fantastic news! We've Found the answer you've been seeking!
Step by Step Answer:
a b c x ax a...View the full answer

Answered By
Branice Buyengo Ajevi
I have been teaching for the last 5 years which has strengthened my interaction with students of different level.
1+ Reviews
10+ Question Solved
Related Book For 

Question Posted:
