

The graph shows the profit P (in dollars) from selling units of an item. Use the graph
Question:
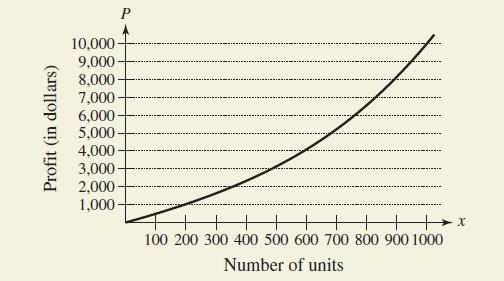
The graph shows the profit P (in dollars) from selling units of an item. Use the graph to determine which is greater, the change in profit when the production level changes from 400 to 401 units or the change in profit when the production level changes from 900 to 901 units. Explain your reasoning
Fantastic news! We've Found the answer you've been seeking!
Step by Step Answer:
Because the slope of the ...View the full answer

Answered By
Muhammad adeel
I am a professional Process/Mechanical engineer having a vast 7 years experience in process industry as well as in academic studies as a instructor. Also equipped with Nebosh IGC and lead auditor (certified).
Having worked at top notch engineering firms, i possess abilities such as designing process equipment, maintaining data sheets, working on projects, technical biddings, designing PFD and PID's etc.
Having worked as an instructor in different engineering institutes and have been involved in different engineering resrearch projects such as refinery equipment designing, thermodynamics, fluid dynamics, chemistry, rotary equipment etc
I can assure a good job within your budget and time deadline
52+ Reviews
60+ Question Solved
Related Book For 

Question Posted:
