

Question: Each object you can manipulate or place on the graph has its own unique features as well as some features that are shared with
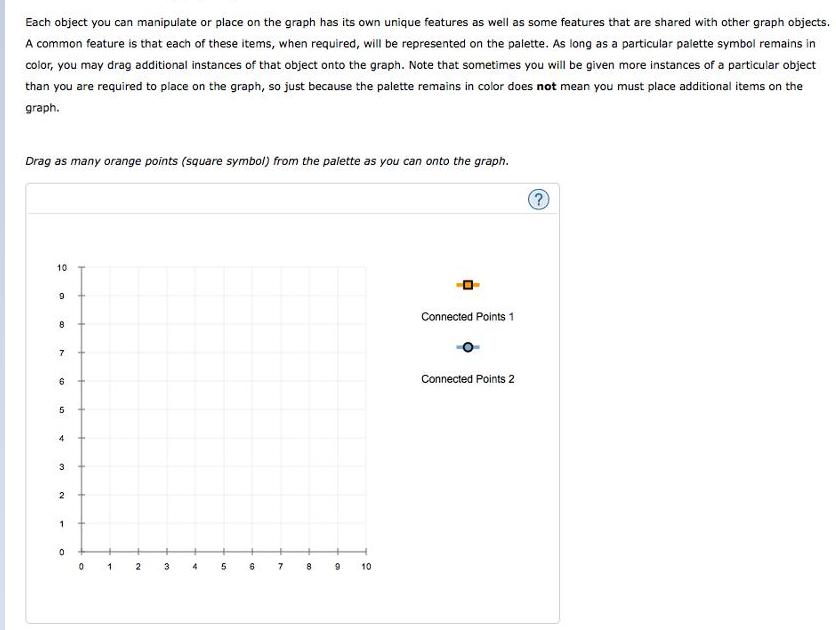
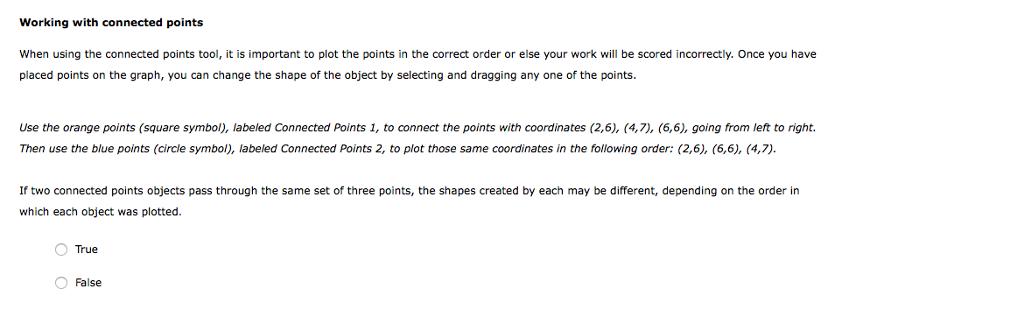
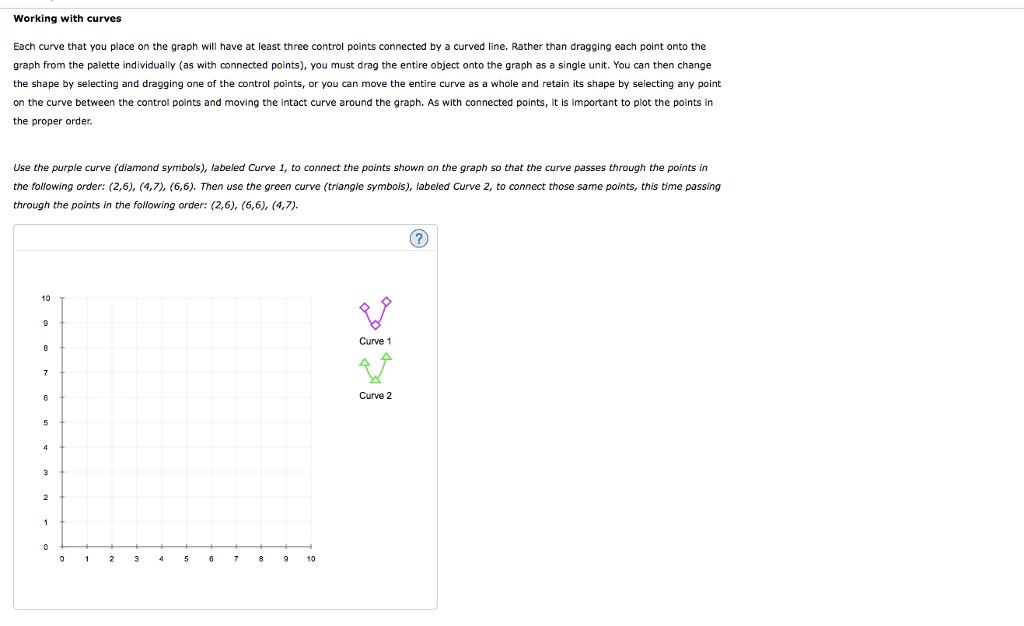
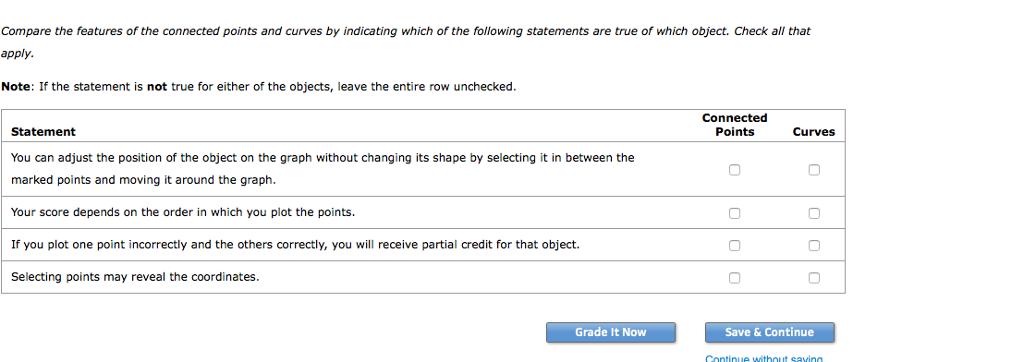
Each object you can manipulate or place on the graph has its own unique features as well as some features that are shared with other graph objects. A common feature is that each of these items, when required, will be represented on the palette. As long as a particular paiette symbol remains in color, you may drag additional instances of that object onto the graph. Note that sometimes you will be given more instances of a particular object than you are required to place on the graph, so just because the palette remains in color does not mean you must place additional items on the graph. Drag as many orange points (square symbol) from the palette as you can onto the graph. 10 Connected Points 1 8 7. Connected Points 2 5 3 4 5 6. 7. 8 10 Working with connected points When using the connected points tool, it is important to plot the points in the correct order or else your work will be scored incorrectly. Once you have placed points on the graph, you can change the shape of the object by selecting and dragging any one of the points. Use the orange points (square symbol), labeled Connected Points 1, to connect the points with coordinates (2,6), (4,7), (6,6), going from left to right. Then use the blue points (circle symbol), labeled Connected Points 2, to plot those same coordinates in the following order: (2,6), (6,6), (4,7). If two connected points objects pass through the same set of three points, the shapes created by each may be different, depending on the order in which each object was plotted. O True O False Working with curves Each curve that you place on the graph will have at least three control points connected by a curved line. Rather than dragging each point onto the graph from the palette individually (as with connected points), you must drag the entire object onto the graph as a single unit. You can then change the shape by selecting and dragging one of the control points, or you can move the entire curve as a whole and retain its shape by selecting any point on the curve between the control points and moving the intact curve around the graph. As with connected points, it is important to plot the points in the proper order. Use the purple curve (diamond symbols), labeled Curve 1, to connect the points shown on the graph so that the curve passes through the points in the following order: (2,6), (4,7), (6,6). Then use the green curve (triangle symbois), labeled Curve 2, to connect those same points, this time passing through the points in the following order: (2,6), (6,6), (4,7). 10 Curve 1 Curve 2 3 2 3 5 8 10 Compare the features of the connected points and curves by indicating which of the following statements are true of which object. Check all that apply. Note: If the statement is not true for either of the objects, leave the entire row unchecked. Connected Statement Points Curves You can adjust the position of the object on the graph without changing its shape by selecting it in between the marked points and moving around the graph. Your score depends on the order in which you plot the points. If you plot one point incorrectly and the others correctly, you will receive partial credit for that object. Selecting points may reveal the coordinates. Grade It Now Save & Continue Continue withnut saving
Step by Step Solution
3.35 Rating (161 Votes )
There are 3 Steps involved in it

Get step-by-step solutions from verified subject matter experts
Document Format (2 attachments)
635e071f9e25b_180847.pdf
180 KBs PDF File
635e071f9e25b_180847.docx
120 KBs Word File