

The graph shows the profit P (in thousands of dollars) of a company in terms of its
Question:
The graph shows the profit P (in thousands of dollars) of a company in terms of its advertising cost x (in thousands of dollars).
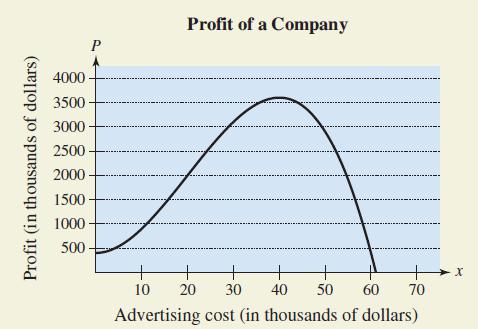
(a) Estimate the interval on which the profit is increasing.
(b) Estimate the interval on which the profit is decreasing.
(c) Estimate the amount of money the company should spend on advertising in order to yield a maximum profit.
(d) The point of diminishing returns is the point at which the rate of growth of the profit function begins to decline. Estimate the point of diminishing returns.
Fantastic news! We've Found the answer you've been seeking!
Step by Step Answer:
a The profit is increasing on 0 40 b The profit is dec...View the full answer

Answered By
PALASH JHANWAR
I am a Chartered Accountant with AIR 45 in CA - IPCC. I am a Merit Holder ( B.Com ). The following is my educational details.
PLEASE ACCESS MY RESUME FROM THE FOLLOWING LINK: https://drive.google.com/file/d/1hYR1uch-ff6MRC_cDB07K6VqY9kQ3SFL/view?usp=sharing
3+ Reviews
10+ Question Solved
Related Book For 

Question Posted:
