

Question: The table lists the speeds S (in feet per second) of a falling object at various times t (in seconds). (a) Create a line graph
The table lists the speeds S (in feet per second) of a falling object at various times t (in seconds).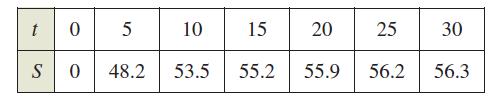 (a) Create a line graph of the data.
(b) Does there appear to be a limiting speed of the object? If there is a limiting speed, identify a possible cause.
t 0 S 0 5 48.2 10 53.5 15 20 25 55.2 55.9 56.2 30 56.3
Step by Step Solution
★★★★★
3.36 Rating (165 Votes )
There are 3 Steps involved in it
1 Expert Approved Answer
Step: 1 Unlock

a Here is a line graph of the data 60 55 50 45 40 0 10 ... View full answer
Question Has Been Solved by an Expert!
Get step-by-step solutions from verified subject matter experts
Step: 2 Unlock
Step: 3 Unlock